
Energy and carbon reporting
Know what your PCs use, cost and emit.
Acquaintia estimates the energy every PC uses from its hardware and the hours it spends active, idle, asleep and off. Apply your own tariffs and carbon factors, compare against a baseline, and report by PC, by location or across the organisation.
How the estimate is built
From each PC's hardware to your carbon figure.
There is nothing to plug in and no meters to fit. Every figure comes from what Acquaintia already knows about each PC, and the rates you give it.
Wattage profile
What the PC draws
By make and model where Acquaintia has one, then by system type, plus each monitor the agent detects.
Time in each state
How long it spent there
Active, idle, asleep and off, reported by the agent on the PC.
Estimated energy
kWh, per PC
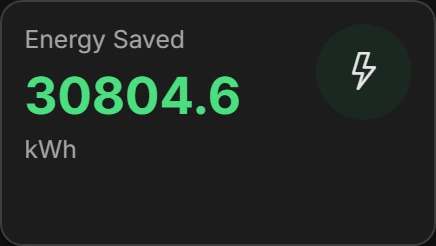
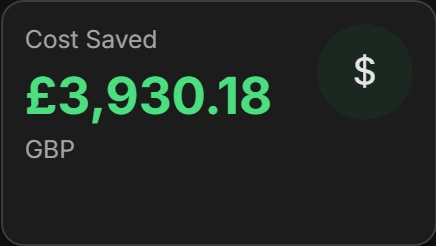
- × your tariff = cost
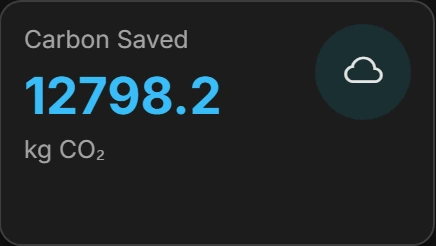
- × your carbon factor = CO2e
- − the baseline = what changed
The electricity an organisation buys is part of its Scope 2 emissions under the Greenhouse Gas Protocol. Acquaintia gives you the PC share of it, per machine and per location, with the factor you report with.
Tariffs
Your suppliers, your rates, your factors.
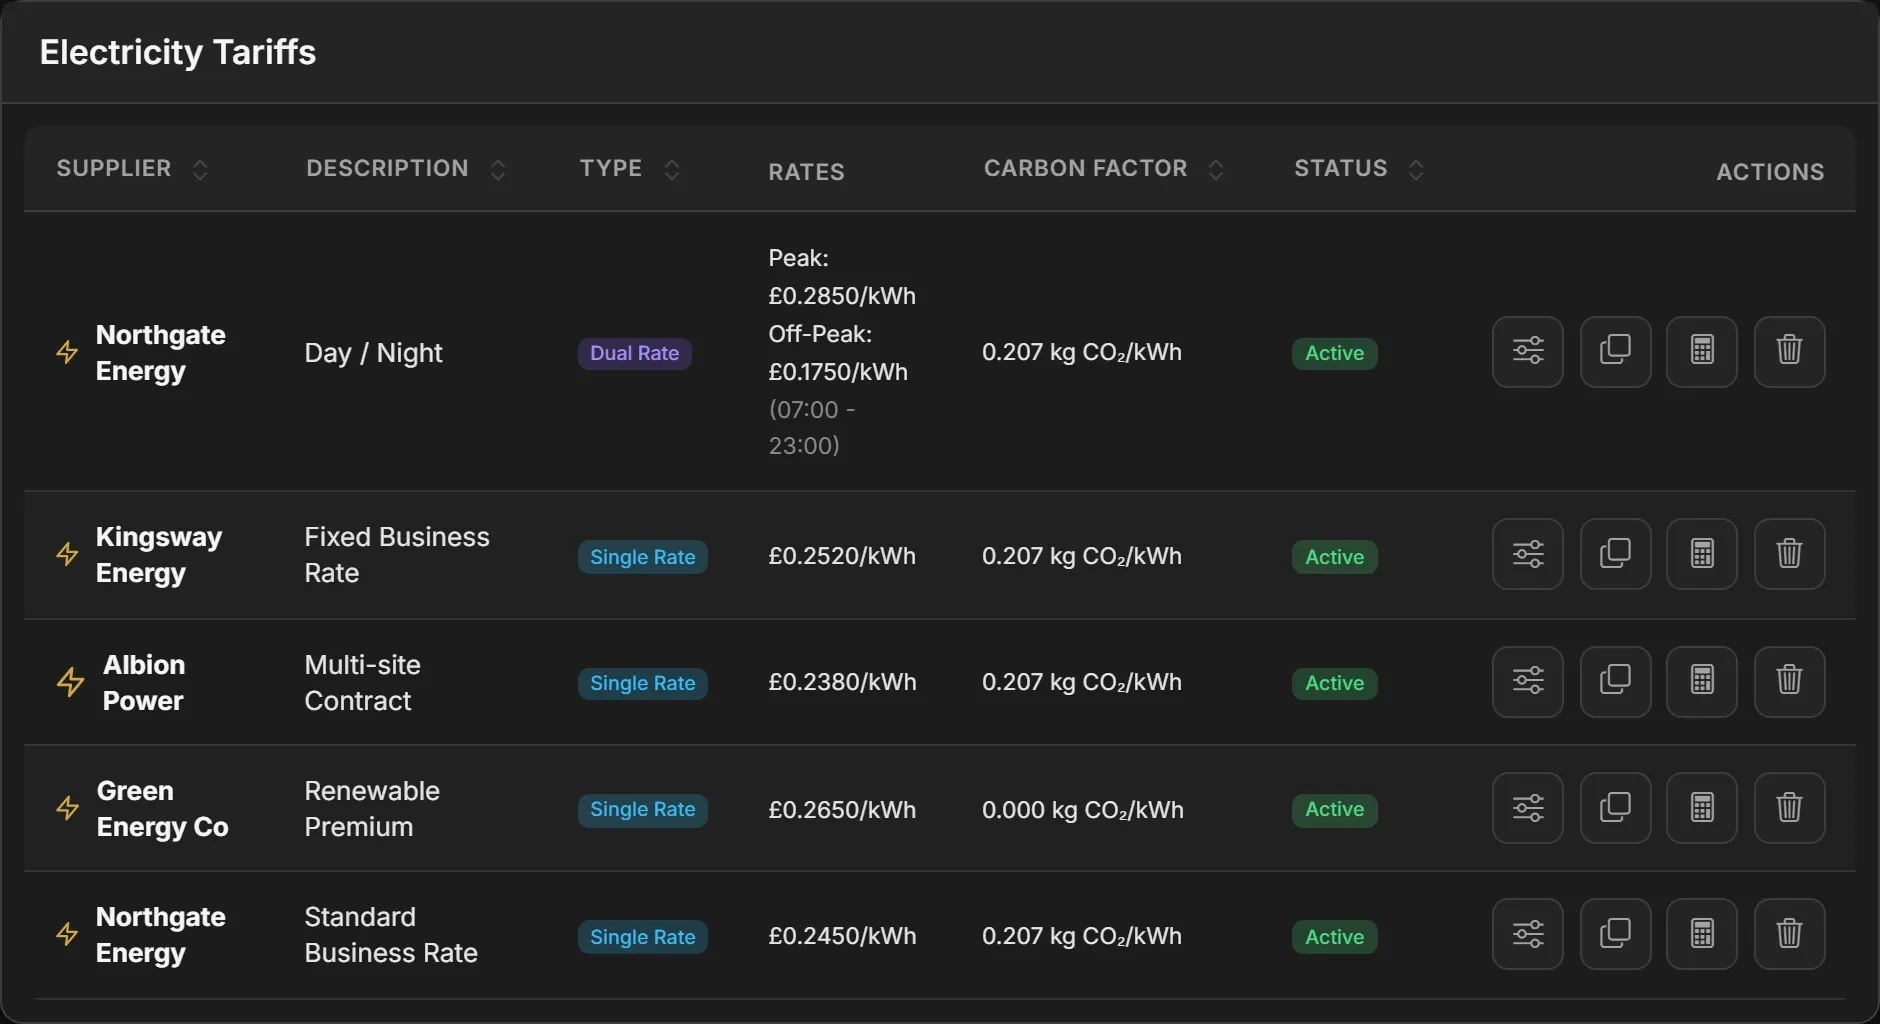
Add each electricity supplier and tariff, at a single rate or with day and night rates, and the carbon factor that goes with it. Assign tariffs to locations: every site and floor below inherits them unless you set its own.
Reports
Eight reports, one set of numbers.
Choose the locations and the period. Save the reports you run often, share them with colleagues, and export any of them as CSV.
- Usage
- Estimated kWh and cost, by location, PC and period.
- Savings
- Energy, cost and carbon against the baseline you choose.
- Comparison
- A period set against its baseline.
- Time
- Hours each PC spent active, idle, asleep and off.
- Active and idle
- How much of the time PCs were on was spent unused.
- Users
- Power use by the people signed in.
- Hardware
- Your fleet by system type, and which PCs can hibernate.
- Powered-off actions
- How and why PCs slept or shut down.
Baselines
Measured against where you started.
Pick the period before your policies applied as the baseline, or let Acquaintia create one every month, quarter or year. Savings reports show energy, cost and carbon against it.
Dashboard
The headline, every morning.
Savings against the baseline, the energy trend, the PCs using the most, and after-hours use. Smart Alerts point out PCs with no policy, PCs with no tariff, and hibernate-capable PCs that have no policy yet.
Want a first figure before a demo? Work out what idle PCs cost you.
Questions
Are the figures measured?
No, they are estimates. Acquaintia gives each PC a wattage profile from its make and model, its system type and its monitors, and multiplies it by the time the PC spends in each power state. You can refine the profiles as you learn more about your hardware.
Which carbon factor should I use?
The one your organisation reports with. Each tariff carries its own factor in kilograms of CO2e per kWh. UK organisations often use the government greenhouse gas conversion factor for grid electricity, which is updated every year.
What is a baseline?
A period you measure against, usually from before your policies applied. Choose one yourself, or have Acquaintia create baselines monthly, quarterly or yearly.
Can I export reports?
Yes, as CSV. Reports can also be saved and shared with other people who use Acquaintia.
Put a number on every PC.
Book a demo and we'll show you the reports, set up with tariffs and a carbon factor like yours.